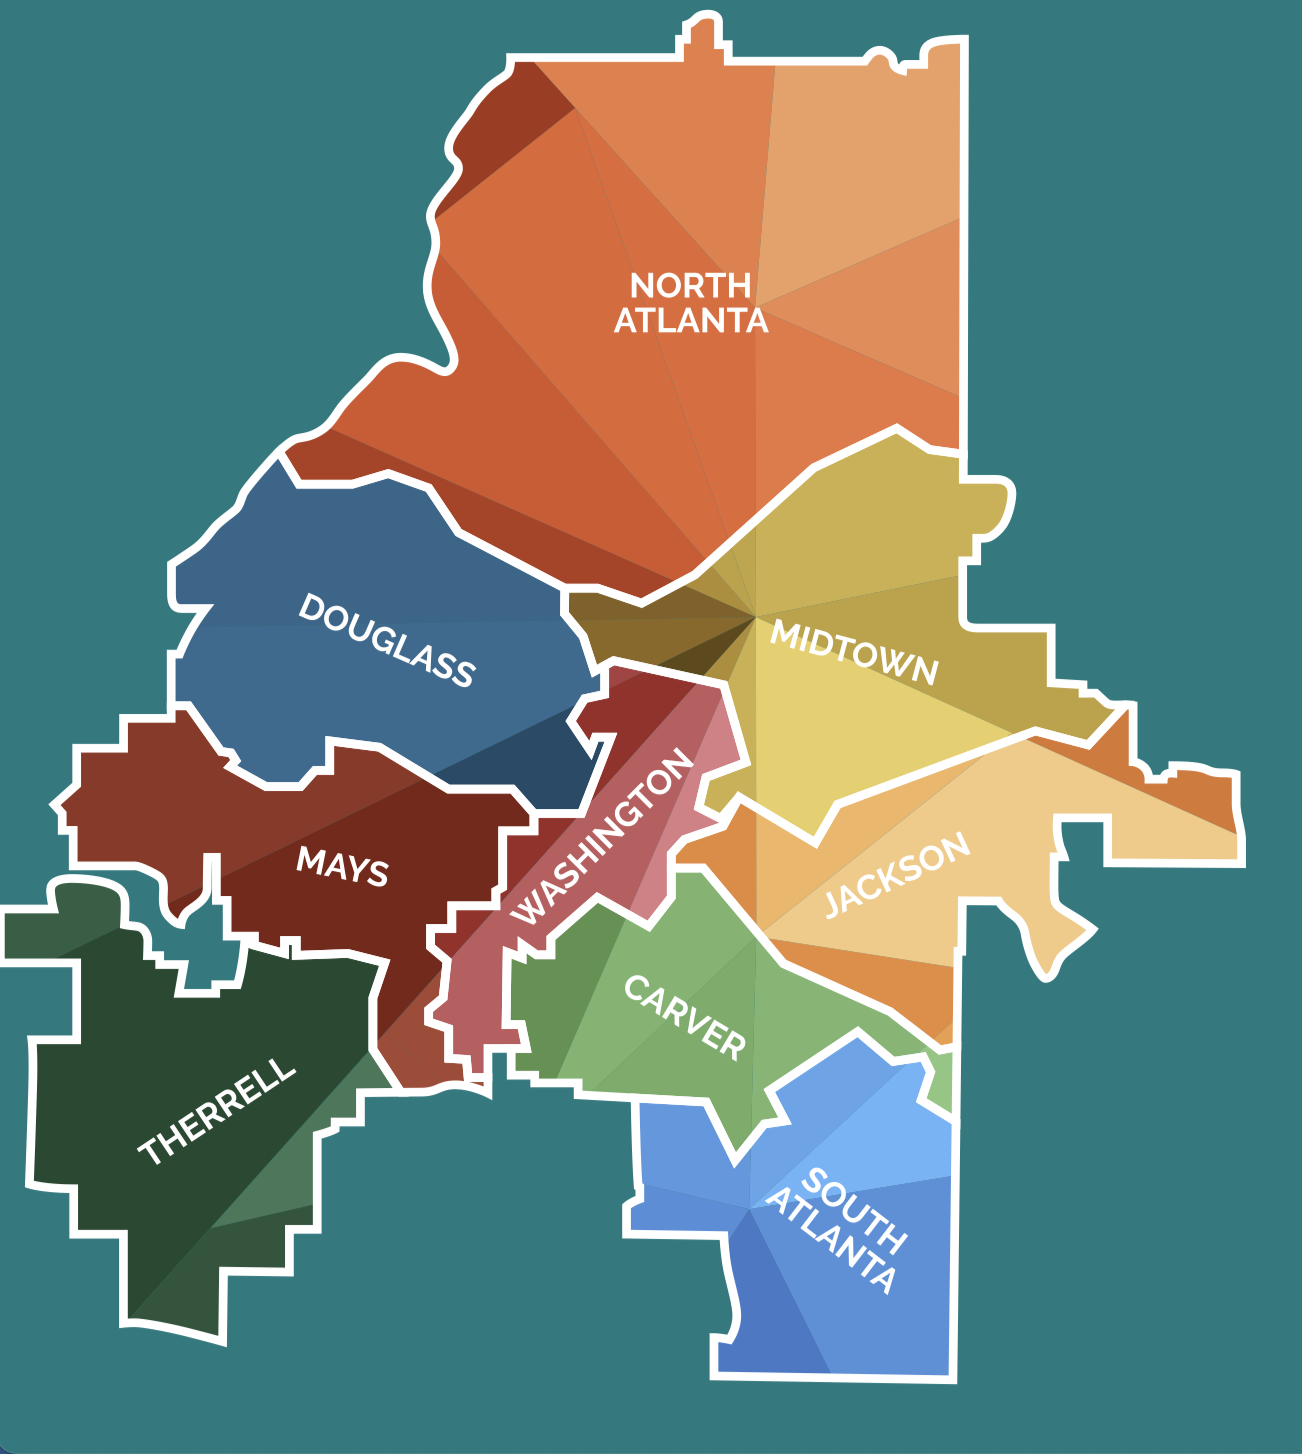
Student Demographics
Student Demographics
To compare school data, click on the school(s) name to hide it’s data on the chart.
Student enrollment - 2022
North Atlanta Cluster Grades K-5
*There are too few Asian and American Indian students
Student enrollment - 2022
North Atlanta Cluster Grades 6-12
Enrollment by race - 2022
North Atlanta Cluster Grades K-5
Enrollment by race - 2022
North Atlanta Cluster Grades 6-12
Enrollment by subgroup - 2022
North Atlanta Cluster Grades K-5
Enrollment by subgroup - 2022
North Atlanta Cluster Grades 6-12
Graduation Rates
To compare school data, click on the school(s) name to hide it’s data on the chart.
Graduation Rate by subgroup - 2022
North Atlanta Cluster
Graduation Rate by race - 2022
North Atlanta Cluster
*There are too few American Indian and Asian students
Achievement Scores
Reading on or above grade level - 2022
North Atlanta Cluster Grades K-5
Reading on or above grade level - 2022
North Atlanta Cluster Grades 6-12
Math on or above grade level - 2022
North Atlanta Cluster Grades K-5
Math on or above grade level - 2022
North Atlanta Cluster Grades 6-12
Source: Georgia Milestones 2021-2022 Statewide Scores (GaDOE)
Student Discipline
To compare school data, click on the school(s) name to hide it’s data on the chart.
Suspensions (in-school & out of school) - 2022
North Atlanta Cluster Grades K-5
Suspensions (in-school & out of school) - 2022
North Atlanta Cluster Grades 6-12
*The percentage of disciplinary infractions resulting in suspensions
Disciplinary infractions rate - 2022
North Atlanta Cluster Grades K-5
Disciplinary infractions rate - 2022
North Atlanta Cluster Grades 6-12
*Percent of student population that had disciplinary infractions
Source: Governor’s Office of Student Achievement K-12 Discipline Dashboard (GOSA)


