Menu
2024 Data
2023 Data
2022 Data
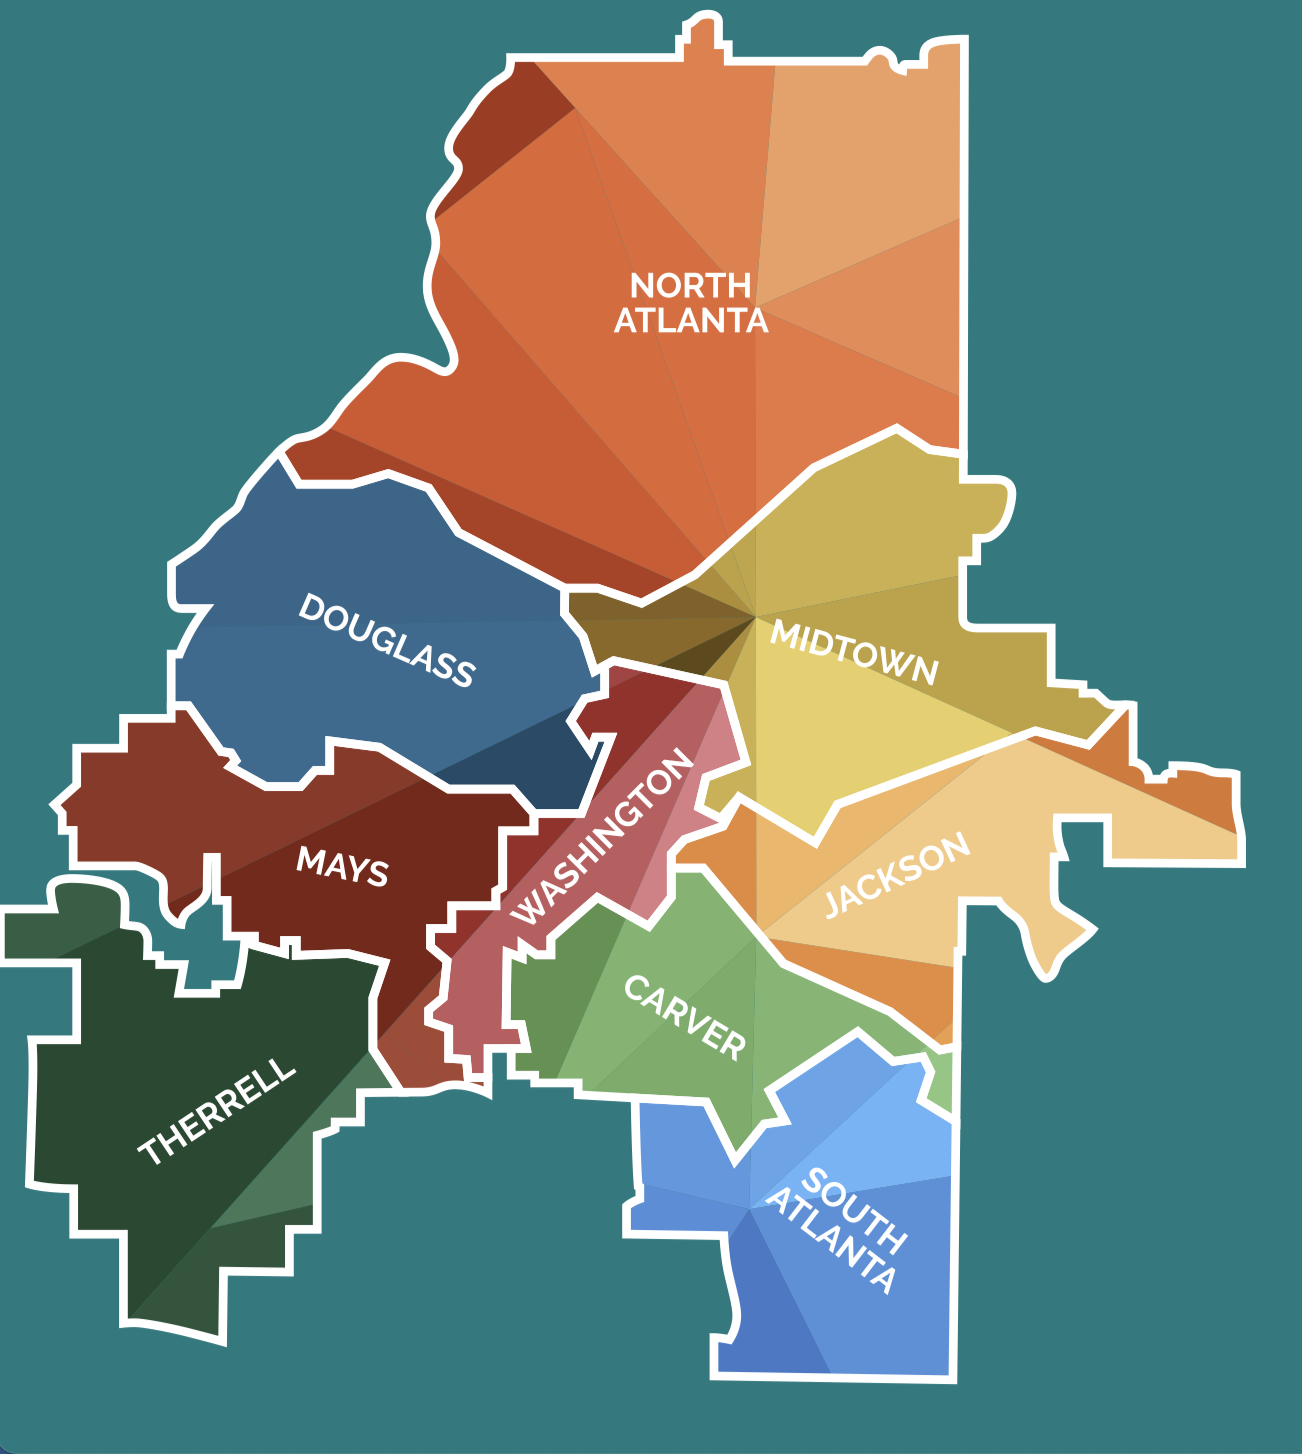
Compare School Quality Data Across Clusters
Compare all school public school types by cluster based on enrollment, reading and math proficiency, graduation, and suspension rates. Subgroup data is available when applicable.
To compare clusters, click on a data point below to remove or add it to the chart
Compare School Quality Across Clusters
Compare All Data - 2023
To compare clusters, click on a data point to hide it from the chart
*data includes all school types
Student Demographics
Total Student enrollment - 2023
To compare clusters, click on a data point to hide it from the chart
Enrollment by subgroup - 2023
By Race - 2023
By Economically Disadvantaged & Students with disabilities - 2023
Achievement Scores
Reading & Math Proficiency - 2023
Graduation
Graduation Rate - 2023
Discipline
Suspension Rate - 2023
To compare clusters, click on a data point to hide it from the chart